Physical Address
304 North Cardinal St.
Dorchester Center, MA 02124
Physical Address
304 North Cardinal St.
Dorchester Center, MA 02124

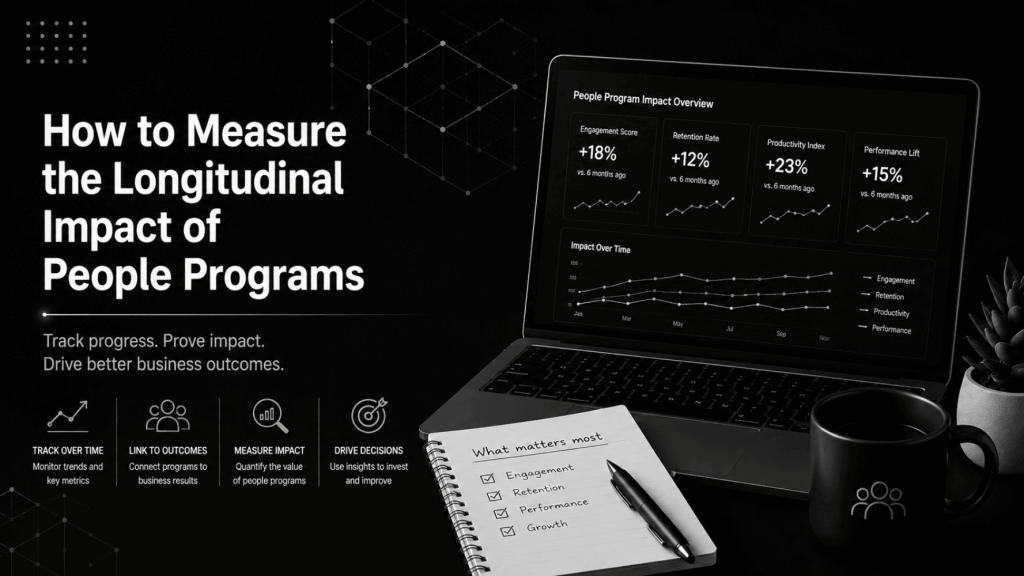
To measure people program impact over time, you need to track the same employee cohort across multiple time points, using a consistent outcome metric, against a comparison group. Set up the data design before the program starts. Identify your cohort, pick one to three business-outcome metrics you can pull from your HRIS or payroll system, assign a comparison group, and schedule measurement intervals at 30, 90, and 180 days post-program. A pre/post survey is not a substitute for this structure.
Most HR teams declare a program successful based on a post-program satisfaction score. That number measures how people felt in the room, not what changed in the business. Six months later, when a CFO asks whether the leadership development investment moved retention or performance ratings, the answer is usually a shrug. This guide explains how to build a measurement approach that can actually answer that question, what data infrastructure you need, and where most platforms fall short.
A pre/post survey measures two snapshots with no context between them. It cannot tell you whether an effect was immediate and faded, delayed and then grew, or driven by something else entirely, like a new manager or a compensation adjustment that happened in the same quarter.
The core problem is attribution. If engagement scores rise after a well-being program, you need to know whether participants rose faster than non-participants, whether the effect lasted, and whether it correlated with a business outcome you actually care about. A survey taken one week after a program ends answers none of those questions. It is feedback data dressed up as impact data.
Longitudinal measurement treats time as a variable. You are not comparing before and after. You are comparing rates of change across cohorts over defined intervals. That requires a fundamentally different data structure from day one.
Four components are non-negotiable.
Every employee who participated in the program needs a persistent ID that survives any system migrations, name changes, or role changes. This sounds obvious. In practice, it breaks constantly when companies run separate systems for HRIS, LMS, and payroll with no shared key. If you cannot match a participant record at month one to the same person at month twelve, you have no longitudinal data.
Pick one to three metrics before the program launches. Good candidates include voluntary attrition rate, performance rating distribution, internal mobility rate, absenteeism, and manager effectiveness scores. All of these exist in systems you already own. Picking the metric after the program ends, based on what moved, is not measurement. That is post-hoc narrative building.
A control group in the strict experimental sense is rarely feasible in a corporate setting. A comparison group is. Find employees who did not participate in the program but are similar on role, tenure, manager, and business unit. Track the same metrics for both groups across the same time horizon. The divergence between cohorts is where you find signal.
Set measurement intervals before the program begins. A reasonable default for most people programs is 30 days post-program, 90 days, and 180 days. For longer programs like leadership development or coaching cohorts, add a 12-month pull. Each interval requires a data pull from your HRIS or analytics platform, not a new survey. The outcome metrics are behavioral and organizational, not self-reported.
This is where most HR teams lose the measurement opportunity entirely. They think about data after the program. By then, the comparison group is undefined, the baseline metrics were never pulled, and the cohort list lives in a spreadsheet that does not match any system ID.
Before a program launches, complete this sequence:
This takes roughly four hours before program launch. Teams that skip it spend months trying to reconstruct it and almost always fail.
Not all platforms are equal here. The key capability to look for is event-level data storage with timestamped employee records, not period-end snapshots. Period-end snapshots show you where someone ended up. Event-level data shows you the trajectory.
| Capability | Why It Matters for Longitudinal Work | What to Ask Vendors |
|---|---|---|
| Stable employee ID across data sources | Supports cohort tracking across system changes | “How do you handle employee ID changes after an HRIS migration?” |
| Event-level data retention | Captures trajectory, not just endpoints | “Do you store individual transaction events or period-end aggregates?” |
| Cohort analysis module | Automates repeated measurement across defined groups | “Can I define a cohort today and run the same analysis at 90 and 180 days without rebuilding it?” |
| Outcome metric connectors | Pulls retention, performance, and mobility from HRIS/payroll | “Which HRIS and payroll systems do you have native connectors for?” |
| Comparison group controls | Supports matched comparisons, not just raw cohort averages | “Can I filter the comparison group by tenure band and business unit simultaneously?” |
Platforms like Visier, One Model, and OrgVue are designed around persistent employee data models and support true cohort analysis. Most engagement survey platforms, including pulse tools, are not built for this work. They store survey responses, not the operational HR data you need for outcome metrics. If you are evaluating platforms specifically for this capability, the 10 best AI people analytics platforms for workforce planning breaks down which tools are built for analytical depth versus reporting convenience.
The honest caveat: even a strong analytics platform cannot rescue a bad data design. If you did not pull a baseline before the program launched, no vendor can recover it.
This is the hardest part of longitudinal HR measurement, and most guides skip it. Confounding factors are variables that change alongside your program and could explain any movement in your outcome metrics. Common culprits include a compensation increase that rolled out in the same quarter, a manager change for part of the cohort, a business unit restructure, or a company-wide engagement initiative.
You cannot eliminate confounders with a corporate measurement design. You can control for them by documenting what else happened during the measurement window and by building your comparison group carefully. If you match participants and non-participants on business unit, the effects of a unit-level restructure cancel out between the two groups.
A practical tool is a simple confound log: a running document where you record any organization-wide or cohort-specific changes that occurred during the measurement period. When you present results, the confound log is what allows you to say, “Retention improved 8 percentage points more in the cohort than in the comparison group, and we know compensation was held constant for both groups during this period.” Without the log, any result you report is vulnerable to a CFO asking, “But didn’t you also give this group a raise?”
This connects directly to how your people analytics function is positioned more broadly. Teams doing this kind of work tend to sit closer to finance and use the same standards of evidence. The framing in people analytics for CFOs covers how to connect workforce data to the business language finance leaders actually respond to.
The right metrics depend on what the program was designed to change. But there is a hierarchy worth following.
Behavioral and operational metrics come first. Voluntary attrition, internal mobility, absenteeism, and promotion rates are observable, auditable, and harder to game than self-reported scores. These should be your primary outcome metrics for almost any people program.
Performance ratings are useful but require careful handling. Rating distributions vary by manager and calibration cycle, so compare within the same manager cohort where possible. Linking program participation to performance management software data directly, rather than pulling exports manually, reduces the risk of cohort mismatch across cycles.
Self-reported survey data belongs in the measurement mix as a secondary signal, not the primary one. Use engagement scores or manager effectiveness scores to understand the mechanism behind behavioral change, not to prove that the program worked.
| Metric Type | Example Metrics | Data Source | Measurement Horizon |
|---|---|---|---|
| Retention | Voluntary attrition rate | HRIS | 90, 180, 365 days |
| Mobility | Internal transfer rate, promotion rate | HRIS | 180, 365 days |
| Performance | Rating band distribution, goal completion | Performance system | Post next cycle (180+ days) |
| Attendance | Unplanned absence rate | HRIS or time and attendance | 90, 180 days |
| Perception | Manager effectiveness score, eNPS | Survey platform | 90, 180 days (secondary) |
Raw percentage point differences by themselves rarely land with finance or operations leaders. They need context: what is the comparison group doing, what does the difference represent in cost terms, and what alternative explanations have been ruled out.
A clean presentation structure runs as follows. Lead with the business metric, not the program narrative. “Voluntary attrition in the program cohort was lower than in the comparison group over 12 months” is a business statement. “Participants reported high satisfaction with the program” is a feedback statement. Boards respond to the first one.
Translate attrition differences into cost. Use a fully-loaded replacement cost figure, which the people analytics vs workforce analytics comparison covers in detail when discussing how these functions are scoped. Even a conservative replacement cost estimate turns a few percentage points of attrition difference into a number that justifies a budget conversation.
Show the trajectory, not just the endpoint. A line chart comparing cohort and comparison group across 30, 90, and 180 days is far more persuasive than a single 12-month number. Trajectory shows durability. It also surfaces cases where an effect appeared at 90 days but faded by 180, which is exactly the kind of finding that should change how a program is designed next time.
Most HR teams overestimate their platform’s capability here and underestimate the data plumbing required. The right diagnostic question is not “does our platform have a cohort analysis feature?” The right question is “does our platform store the historical event-level data needed to reconstruct a cohort baseline from six months ago?”
If the answer is no, and for many HRIS-native reporting tools it will be no, you have three options: build a longitudinal data layer in a separate BI tool like Power BI or Tableau connected directly to your HRIS, add a purpose-built people analytics platform that ingests historical data on implementation, or design the measurement manually using dated HRIS exports stored in a structured folder.
The third option is underrated. A disciplined manual process with clean exports will beat a misconfigured analytics platform on every project. Platform capability amplifies good process. It does not replace it. For teams deciding whether to invest in a dedicated platform versus extending what they already have, the guide on how to choose a people analytics platform covers the decision criteria without assuming you need the most expensive option.
Define a cohort of participants with stable IDs before the program starts. Pull baseline metrics from your HRIS on your chosen outcomes, such as attrition, performance ratings, or mobility rates. Assign a comparison group matched on role, tenure, and business unit. Pull the same metrics at 30, 90, and 180 days post-program and compare the rate of change between the two groups. Self-reported surveys are a secondary signal, not the primary measure.
Longitudinal measurement in HR tracks the same group of employees across multiple time points to observe how a metric changes over time. Unlike a one-time survey, longitudinal measurement captures whether an effect persists, grows, or fades. It requires a stable employee identifier, a pre-defined outcome metric, a comparison group, and scheduled data pulls at regular intervals after the program ends.
A company runs a manager effectiveness program for 200 managers. Before it starts, they pull voluntary attrition rates and engagement scores for those managers’ teams. They identify 200 similar managers who did not participate as a comparison group. At 90 and 180 days, they pull the same metrics for both groups. If attrition in the program group fell relative to the comparison group, and engagement scores moved in the same direction, that is longitudinal evidence of program impact.
Platforms built on event-level data models, including Visier, One Model, and OrgVue, support cohort analysis natively. Most engagement survey tools and HRIS-native reporting modules store period-end snapshots, not event-level records, which limits longitudinal work. The diagnostic question to ask any vendor: “Do you retain historical event-level employee data, and can I define a cohort today and run the same analysis at 180 days without rebuilding it?”
Match your comparison group carefully on role, tenure, business unit, and manager to cancel out variables that affect both groups equally. Keep a running confound log documenting any organization-wide changes, compensation events, or structural changes that occurred during the measurement window. When reporting results, use the log to explain what was held constant, which gives stakeholders confidence that the difference you are reporting is attributable to the program rather than external events.
Not every program needs a full ROI model, but every program benefits from at least one business-outcome metric tracked over time. ROI calculations become most important when program costs are high, the program is recurring, or the executive team is scrutinizing HR spend. For those cases, translate the metric difference between cohort and comparison group into a cost figure using replacement cost, productivity estimates, or compensation data already in your HRIS.
Track for at least 180 days for most people programs. Leadership development and coaching programs warrant 12 months because behavioral change is slower. Shorter programs with immediate operational outputs, like onboarding or compliance training, may show meaningful signal at 90 days. The practical rule: measure for at least as long as the program itself lasted, plus 90 days, and always include at least one performance cycle in the measurement window.
The measurement gap in most HR organizations is not a technology problem. Teams with access to strong platforms still run pre/post surveys and call it impact measurement. The gap is a design habit: the measurement conversation happens after the program, when the data to answer the real questions no longer exists.
Changing that habit requires treating measurement design as part of program design. Before any people program is approved, three questions should have documented answers: what metric are we measuring, who is the comparison group, and when are the data pulls scheduled? If a program cannot answer all three before it launches, it should not launch yet.
The teams doing this well are not necessarily the ones with the most sophisticated tools. They are the ones that have made a standing agreement with their HRIS administrators to pull cohort exports on a defined schedule, and with their business partners to accept operational metrics as the primary evidence of program value. That agreement, not the platform, is what makes longitudinal measurement real.