Physical Address
304 North Cardinal St.
Dorchester Center, MA 02124
Physical Address
304 North Cardinal St.
Dorchester Center, MA 02124

HR Tech SaaS may earn a commission when you buy through links on this page. Our recommendations are editorial and never paid for.
The best compensation benchmarking tools for US mid-market companies are Pave, Payscale, Mercer, Radford (Aon), Carta Total Comp, Compa, Brightmine (formerly XpertHR), CompAnalyst, Figures, and Ravio. Each pulls from different data sources, covers different job families, and fits different company sizes. The right choice depends on whether you need tech-sector precision, broad industry coverage, or a built-in comp planning workflow.
Most HR teams still anchor their pay bands to annual survey data purchased as a flat file or PDF report. The problem is structural. Survey data has an inherent lag: a survey that closes in Q2 is typically published by Q4, meaning the numbers reflect market conditions from months earlier. In a labor market where software engineering salaries moved significantly in both directions across 2022 to 2024, that lag produces pay bands that are either wildly over-market or quietly bleeding talent.
The second problem is granularity. Traditional surveys report medians by job title and broad industry. They do not tell you what a Series B SaaS company in Austin is paying a mid-level product manager versus what a 600-person manufacturer in Ohio is paying the same title. Live benchmarking tools solve this by letting you filter by funding stage, revenue band, geography, and industry vertical before you ever look at a number.
Pay transparency legislation is adding urgency. Colorado’s Equal Pay for Equal Work Act, New York’s salary posting law, and California’s SB 1162 all require employers to either post ranges or produce them on request. A defensible pay band needs to reference a methodology, and “we looked at a Mercer PDF from eighteen months ago” is not one.
Most modern platforms fall into one of two data architectures. The first is submitted payroll data: companies integrate their HRIS or payroll system and share anonymized compensation records in exchange for access to the aggregated dataset. Pave and Carta Total Comp operate this way. The data is current because it updates as payroll runs, but coverage depends on who has opted in.
The second is survey-based data: companies respond to structured questionnaires, and the vendor aggregates and normalizes the responses. Mercer, Radford, and Willis Towers Watson operate this way. Coverage is broader, especially for non-tech industries and executive roles, but the data has an inherent lag tied to survey cycles.
A third model blends crowdsourced self-reported data with employer submissions. Payscale sits here. Self-reported data is cheaper to collect but carries obvious quality risks since individuals tend to overstate or misclassify their roles. Payscale has invested in data validation methodology, but the “How accurate is PayScale’s data?” question in every SERP for this topic tells you buyers remain skeptical.
The most commonly cited data sources among comp practitioners are published salary surveys from firms like Mercer, Willis Towers Watson, and Radford; government data from the Bureau of Labor Statistics; and increasingly, real-time platforms like Payscale and Pave. The BLS Occupational Employment and Wage Statistics database is free and comprehensive but lags by roughly 18 months and lacks the job-family granularity that comp professionals need for actual pay band design.
Mid-market US companies typically combine two or three sources: one broad survey for general benchmarks, one industry-specific source for competitive roles, and sometimes a real-time tool for high-demand positions where the market moves faster than surveys can track. The tools below let you do that within a single platform or at least reduce the number of PDFs you are stitching together in a spreadsheet.
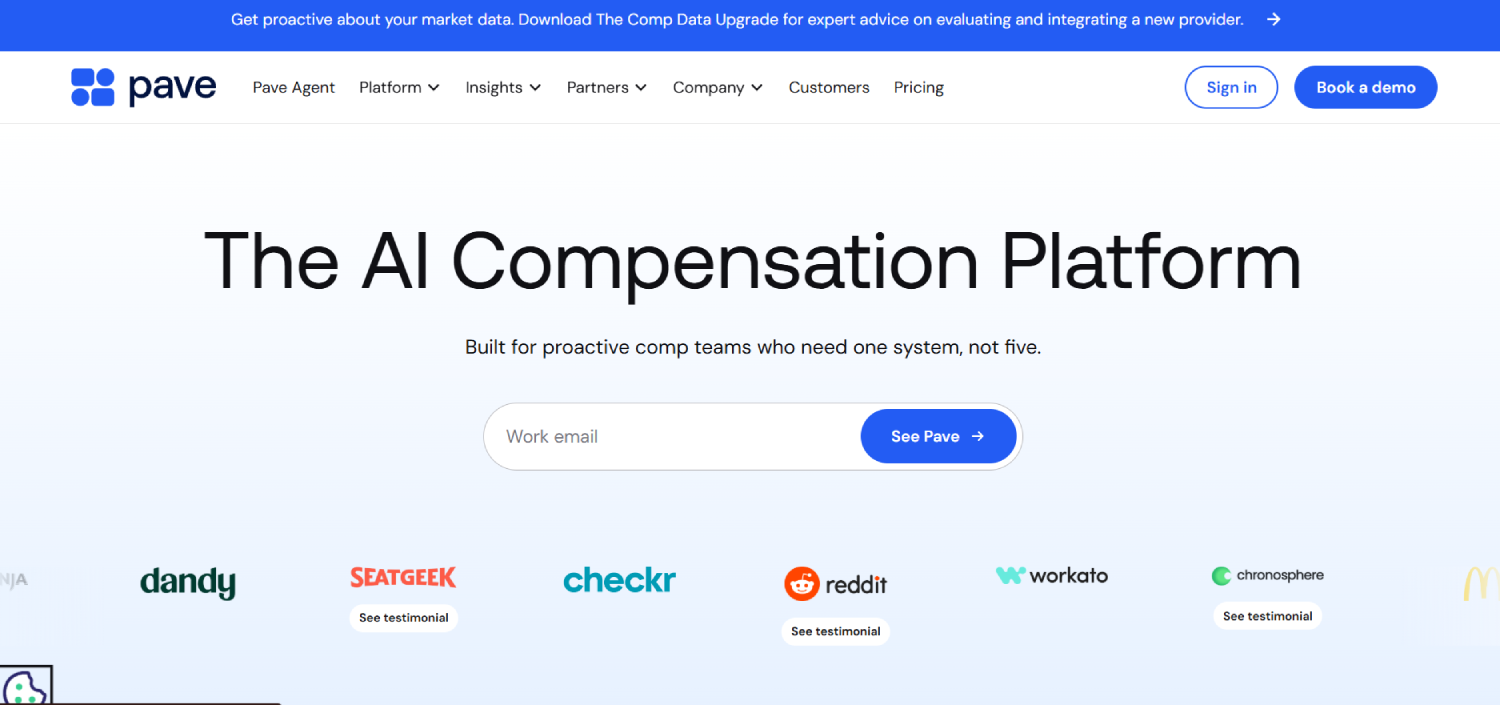
Pave is the strongest choice for VC-backed or post-IPO tech companies. Its data comes from companies that connect their HRIS directly to the platform, producing near-real-time compensation data that reflects actual payroll, not survey responses. Coverage skews heavily toward software, product, and engineering roles at technology companies.
The filtering is granular: you can slice by funding stage (Seed through Series D+), headcount band, revenue range, and US metro area. For a Series C SaaS company trying to figure out what to offer a Staff Engineer in San Francisco, Pave produces more defensible numbers than any annual survey. Pricing is not publicly listed; it is quote-based and typically scales with headcount.
The limitation is coverage outside tech. If you are benchmarking finance, legal, HR, or operations roles at a non-tech company, the dataset thins out. Pave has expanded beyond pure tech but it is still where the data is deepest.
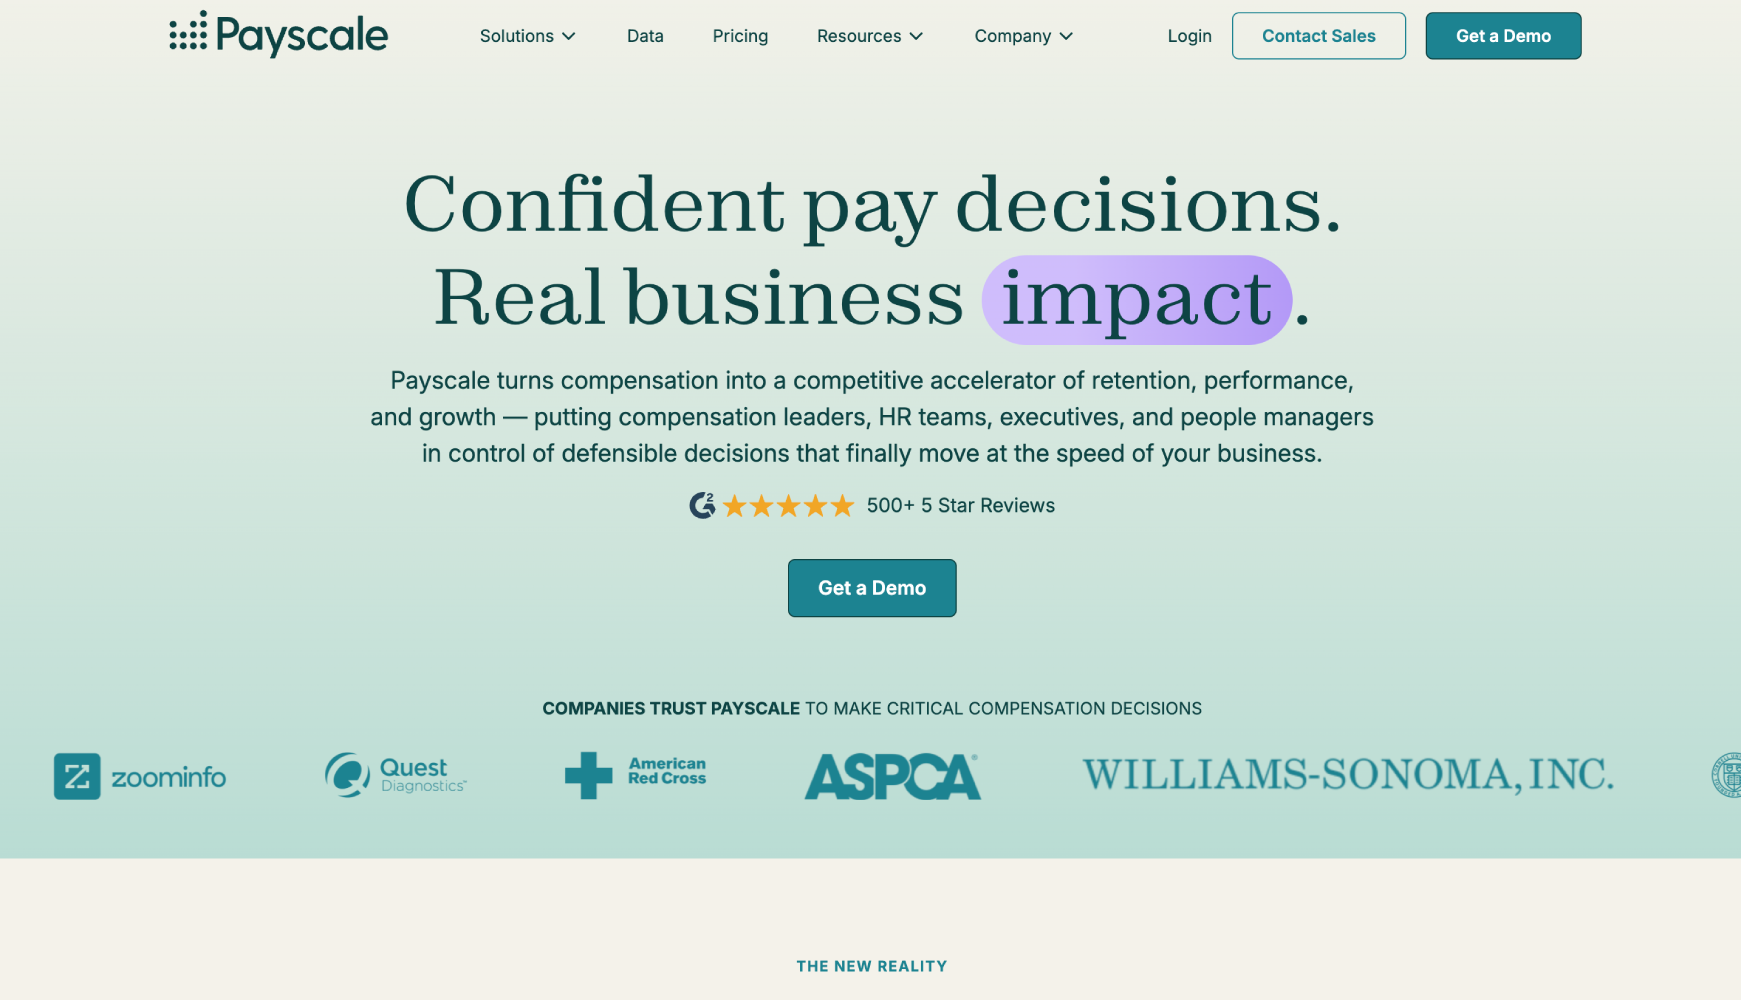
Payscale is the most widely used salary benchmarking software in US mid-market, and for good reason. It covers the broadest range of industries, job families, and geographies of any platform on this list. The CompAnalyst product adds a workflow layer for building pay structures, running market analyses, and modeling merit increases on top of the benchmark data.
The data model is blended: employer-submitted data, individual profiles, and third-party survey data, all normalized and weighted. The “how accurate is PayScale” skepticism is real, and the answer is nuanced. For common job families in major US metros, the data is reliable. For niche technical roles or specialized industries, the sample sizes thin out and the numbers deserve more scrutiny. Pricing for CompAnalyst is quote-based; Payscale’s public pricing page offers entry-level tiers for smaller organizations.
For a company spanning multiple functions and industries, Payscale’s breadth usually wins. You are unlikely to find a role it cannot price, even if the confidence interval on some data points is wider than you’d like.

Mercer runs some of the most cited comp surveys in the US market, including the Mercer Benchmark Database and the US Compensation Planning Survey. The data quality is high, the methodology is transparent, and the job catalog is extensive. Mercer covers every function, every level, and most industries at a depth that VC-backed platforms have not yet matched.
The trade-off is cost and accessibility. Mercer’s surveys are not cheap, and the iMercer platform requires time to learn. For a smaller company with a single comp analyst, the total investment can feel heavy relative to the volume of benchmarking decisions being made. For a larger company running an annual comp review across ten business units, Mercer’s depth pays for itself quickly.
Mercer also publishes the Total Remuneration Survey, which includes benefits and long-term incentives alongside base salary. If you are benchmarking total rewards rather than just cash, that matters.
Radford, now part of Aon’s human capital practice, is the gold standard for technology and life sciences compensation data. The Radford Global Technology Survey is the dataset that most public tech companies and late-stage startups use for their equity and cash benchmarks. If you are competing for talent against FAANG and similar companies, Radford is often the data source your candidates’ offers are built on.
Coverage of equity compensation is where Radford particularly differentiates. The survey captures option grants, RSU refresh rates, and long-term incentive structures in enough detail to build defensible equity bands, not just cash. Access is tied to survey participation, which means you contribute your data to get the full dataset. Pricing is quote-based and scales with the number of surveys accessed.
Radford is overkill for a regional services company under 300 employees. For a 500-person tech company preparing for a Series D or planning IPO readiness, it is often mandatory.
Carta Total Comp pulls compensation data directly from the cap table and HRIS data of companies already on Carta’s platform, which means the equity data is particularly precise. If your company uses Carta for cap table management, the Total Comp product connects that existing infrastructure to a benchmarking layer without requiring a separate data submission process.
The dataset covers startup and growth-stage tech companies comprehensively, with strong coverage of equity grant values relative to other platforms. Cash compensation coverage is solid for engineering and product roles. The platform is less useful for mature companies or non-tech industries where Carta’s user base does not provide sufficient comparable data.
Pricing is not publicly listed. Given the integration with Carta’s existing platform, this is a natural upsell for existing Carta customers rather than a standalone purchase for most buyers.
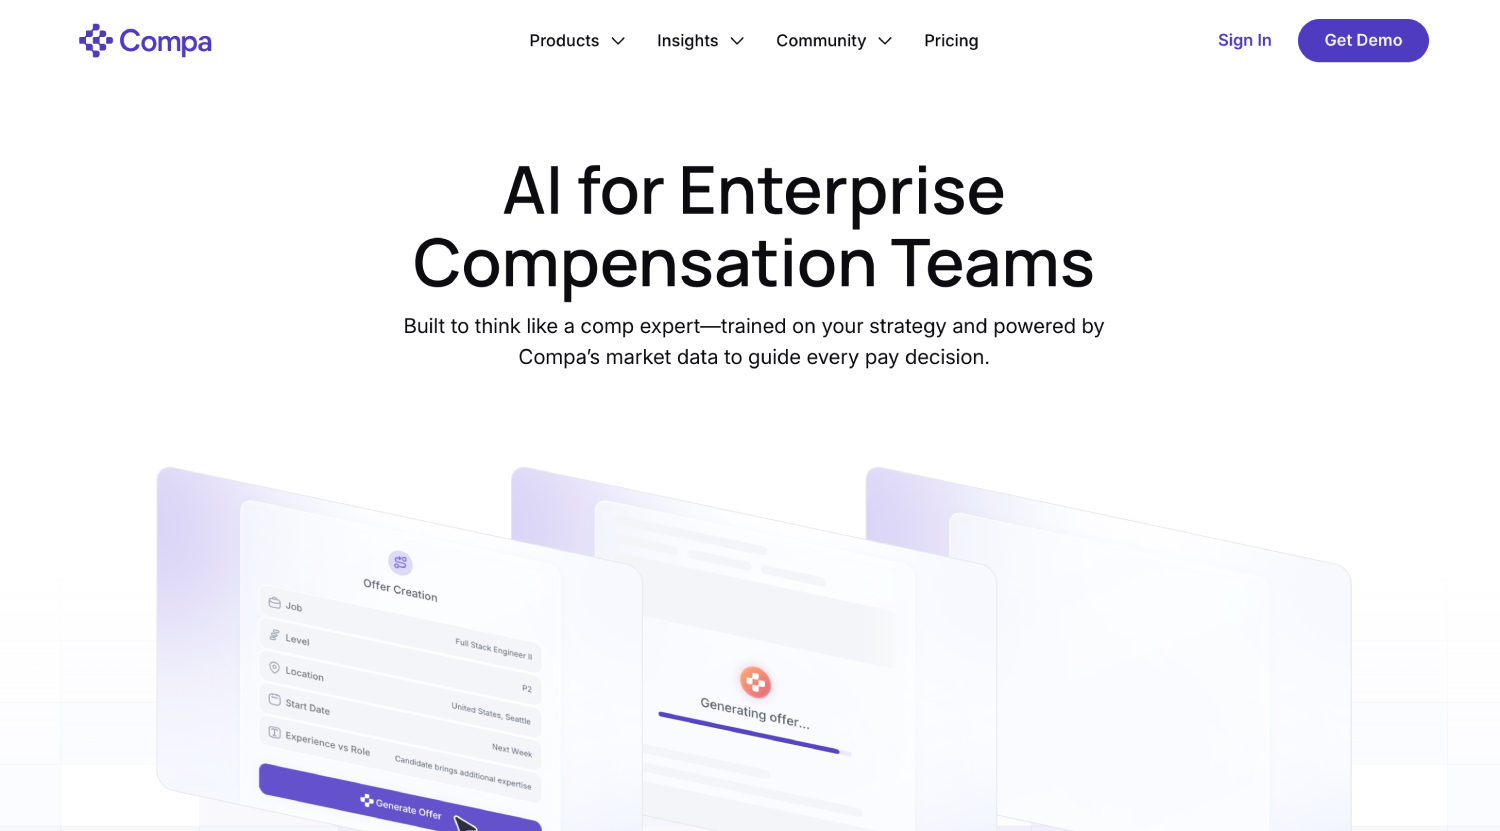
Compa approaches compensation benchmarking from the offer management angle. Rather than replacing your survey data sources, it sits on top of them and provides a workflow for making offer decisions in real time during recruiting. Recruiters can pull benchmarks from multiple sources, see where a candidate’s expectations land relative to your bands, and generate offer approvals without leaving the tool.
This is more useful than it sounds. The gap between having benchmark data and actually using it consistently in offer decisions is where most mid-market companies lose consistency. Compa closes that gap. It integrates with major ATS platforms and pulls from connected compensation data sources rather than maintaining its own primary dataset. Pricing is quote-based.
Brightmine, rebranded from XpertHR in 2023, combines salary benchmarking with HR compliance content. The compensation data covers US roles across a wide range of industries, and the platform pairs that data with legal content on pay equity, salary history bans, and state-specific pay transparency requirements.
For an HR team that needs benchmarking and compliance content from the same vendor, Brightmine is efficient. The compensation data quality is solid for common roles, though it does not match Mercer or Radford in depth for specialized positions. The compliance content layer is genuinely useful given the pace of state-level pay legislation. Pricing is subscription-based and quote-driven.
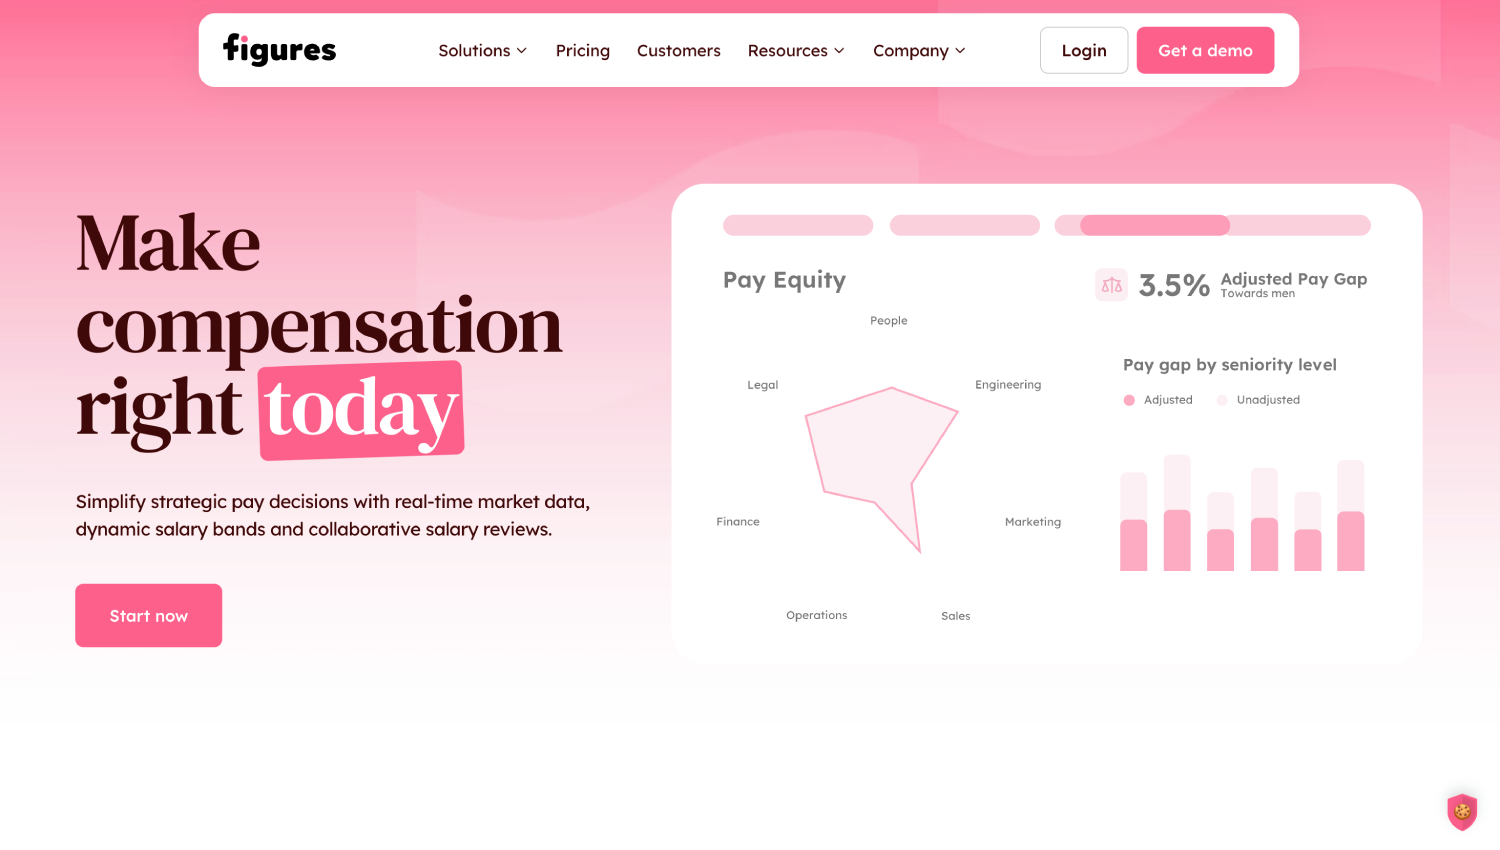
Figures is a European-origin platform expanding into the US market with a real-time data model similar to Pave. Companies connect their HRIS, contribute compensation data, and access the aggregated dataset. The filtering covers funding stage, company size, geography, and job family.
US coverage is growing but still lighter than Pave’s for domestic tech roles. Where Figures differentiates is in companies with a mix of US and European headcount who want a single platform for benchmarking across geographies. If your company has offices in Amsterdam, Berlin, or London alongside your US team, Figures’ European data depth is a real advantage that Pave does not match. Pricing is subscription-based and quote-driven.
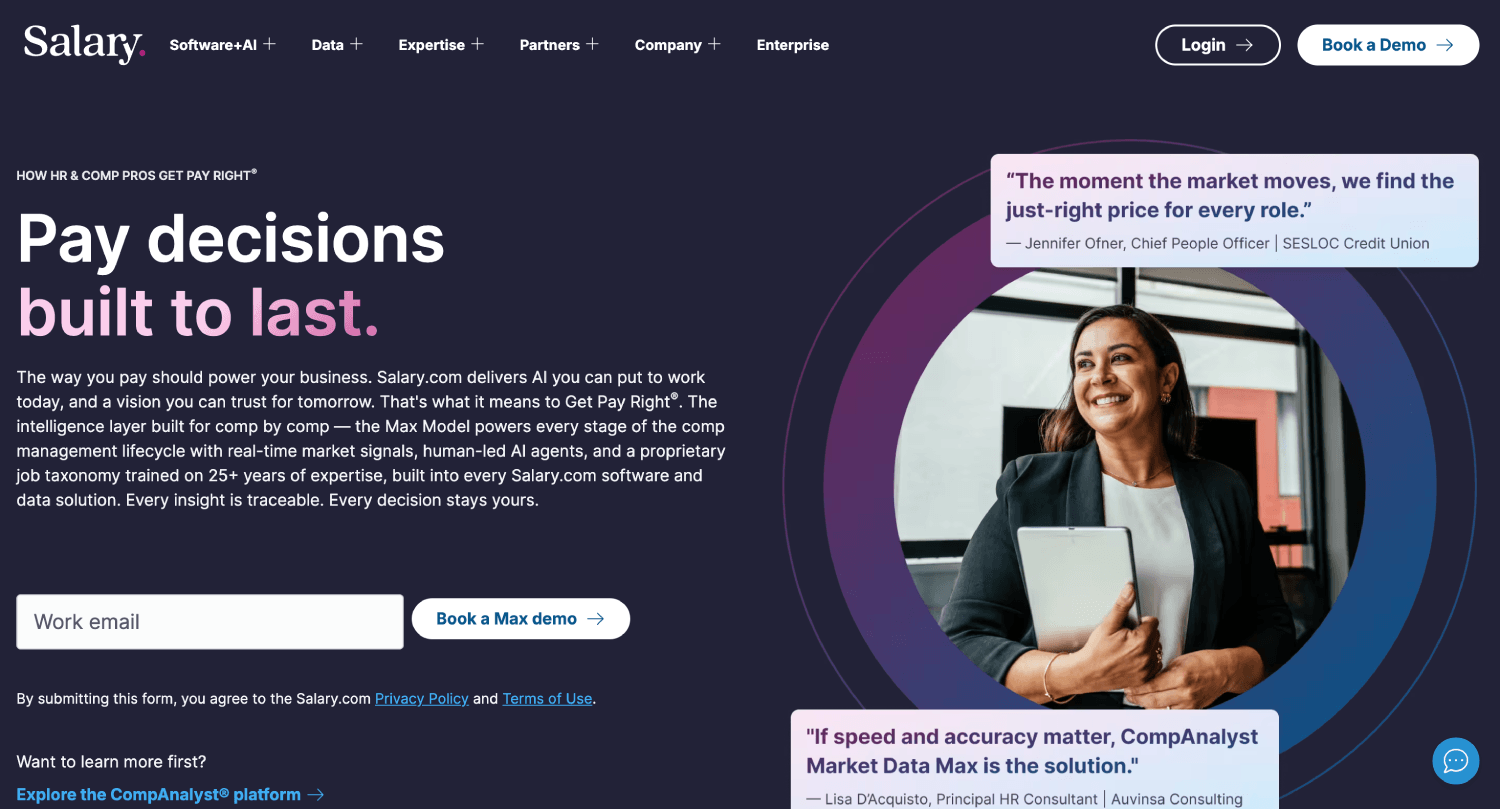
CompAnalyst by Salary.com gives mid-market HR teams a full pay data workflow: market pricing, job matching, pay equity analysis, and compensation structure modeling in one platform. The underlying data pulls from employer surveys, government sources, and third-party datasets, with coverage across most US industries and job families.
The pay equity module is worth calling out separately. It flags potential pay gaps across gender, race, and other protected characteristics using your internal data alongside market benchmarks. For companies building a pay equity narrative for their board or responding to state audit requirements, that built-in analysis reduces the consulting engagement you would otherwise need. Pricing is quote-based, with tiers based on features and user count.
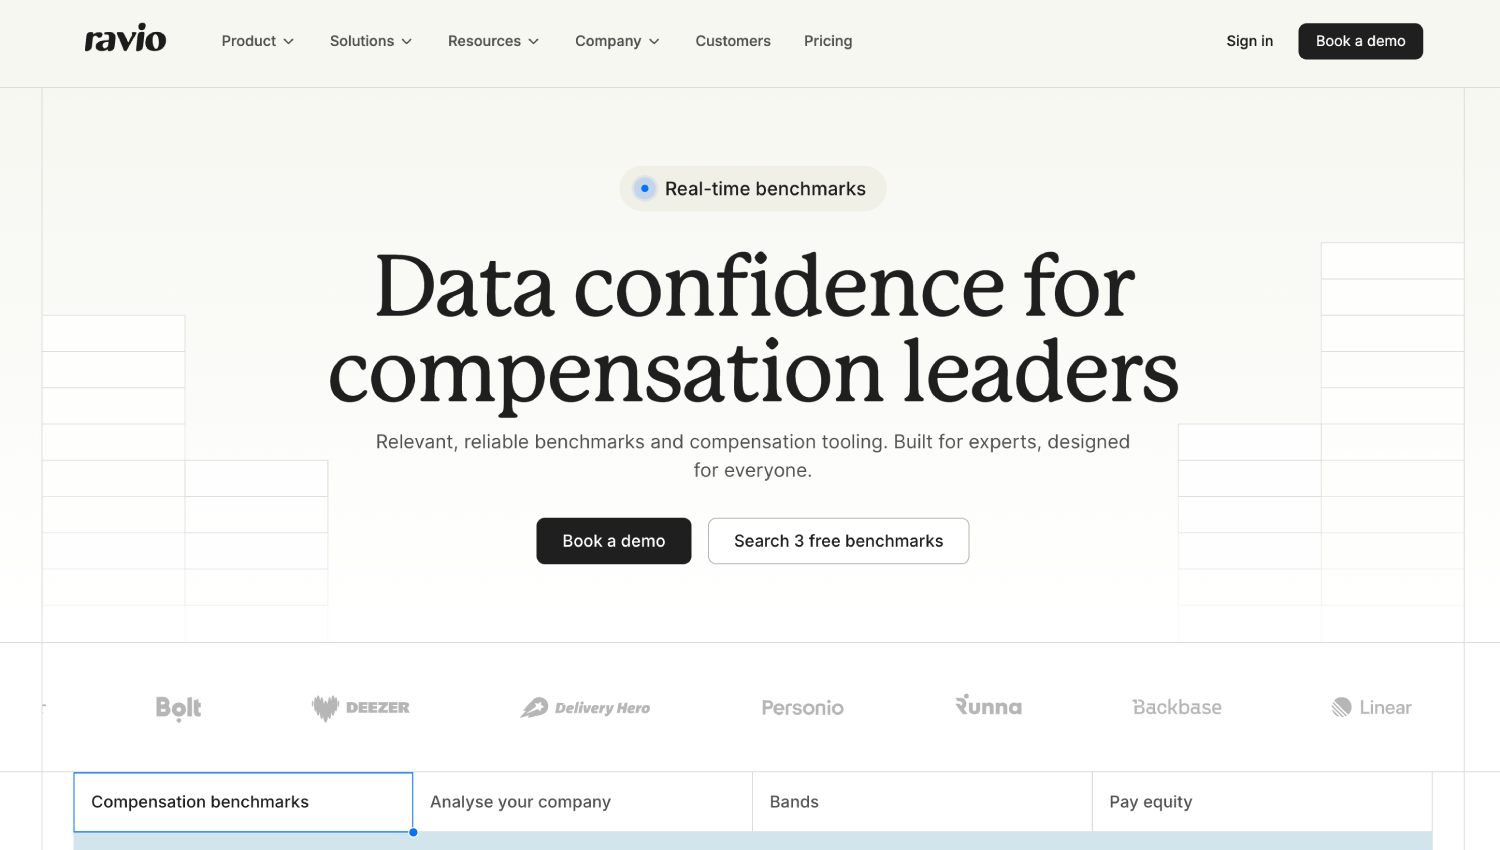
Ravio is another real-time, HRIS-connected platform with strong European roots and growing US coverage. The platform competes in the same space as Pave, Figures, Carta Total Comp, Compa, and Radford and positions itself as a modern alternative to traditional survey-based benchmarking. Ravio’s differentiator is a clean user interface and a free compensation benchmark feature that lets prospective buyers test data quality before committing to a paid tier.
For US-only mid-market companies, Ravio is a credible alternative to Pave rather than a clear winner over it. For companies with European employees, Ravio’s data depth is competitive with Figures. The free benchmark access makes it worth testing regardless of where you ultimately land.
| Tool | Best For | Data Model | US Coverage Depth | Equity Data | Pricing Model |
|---|---|---|---|---|---|
| Pave | VC-backed tech companies | Real-time HRIS-connected | Strong (tech roles) | Yes | Quote-based |
| Payscale / CompAnalyst | Broad US mid-market | Blended (survey + crowdsource) | Very broad | Limited | Quote-based (tiered) |
| Mercer | Enterprise, all industries | Survey-based | Comprehensive | Yes (Total Rewards) | Survey access fees |
| Radford (Aon) | Tech and life sciences | Survey-based (participation required) | Deep (tech/biotech) | Industry-leading | Quote-based |
| Carta Total Comp | Carta platform users, startups | Real-time HRIS + cap table | Strong (startup tech) | Very strong | Quote-based |
| Compa | Offer management workflow | Aggregator (pulls from other sources) | Depends on sources | Via integrations | Quote-based |
| Brightmine | HR teams needing comp + compliance | Survey-based | Solid (common roles) | Limited | Quote-based |
| Figures | US + European teams | Real-time HRIS-connected | Growing | Yes | Quote-based |
| CompAnalyst (Salary.com) | Pay equity + market pricing | Blended | Strong (all industries) | Limited | Quote-based |
| Ravio | US + European teams | Real-time HRIS-connected | Growing | Yes | Quote-based (free tier) |
Payscale’s data accuracy depends heavily on the role and region you are pricing. For high-volume job titles in major US metros, the dataset is large enough to produce reliable medians with reasonable confidence intervals. For niche technical roles, specialized industries, or smaller markets, the sample sizes shrink and the numbers require more scrutiny.
The primary concern with any crowdsourced model is job title inflation. Individuals who self-report their compensation have an incentive to claim a more senior title than they hold, which skews medians upward. Payscale has built validation layers to address this, but the problem does not disappear entirely. Employer-submitted data, which Payscale incorporates through its Payscale Benchmark product, is more reliable than individual profile data.
For most mid-market HR teams running annual compensation reviews, Payscale is accurate enough to build defensible bands for the majority of their roles. For companies where a $10,000 error in a senior engineer’s band causes a retention problem or a recruiting failure, investing in Radford or Pave for those specific roles makes sense, even if you use Payscale for the rest of the population.
A benchmarking tool that sits in isolation is less than half as useful as one that connects to your HRIS and performance management system. The goal is to close the loop: market data informs your pay bands, your HRIS shows where each employee sits within those bands (their compa-ratio), and your performance cycle determines how movement within the band gets allocated during merit reviews.
If you are running compensation management software that connects to performance, most platforms on this list either offer direct integrations or export-compatible data formats for Workday, Rippling, BambooHR, HiBob, and similar systems. Pave integrates with most major HRIS platforms by design. Payscale CompAnalyst integrates with Workday and other enterprise HCMs. Confirm the integration depth before purchasing: some platforms offer a full bidirectional sync, while others export a CSV that your team manually loads.
Pay equity analysis is the second connection point worth building. Tools like CompAnalyst and Brightmine have built-in pay equity modules. If yours does not, your people analytics platform may handle that layer. Our coverage of AI people analytics platforms includes several tools with pay equity analysis capability that can sit alongside a dedicated benchmarking tool.
Start with data relevance, not feature lists. Pull a sample of your ten most competitively priced roles, run them through any vendor’s demo data, and compare the results to what you are currently paying. If the benchmarks land within 10 percent of your current ranges for roles you believe you have priced correctly, the data is probably usable. If it diverges significantly, ask the vendor to explain their job-matching methodology before you buy.
Job matching is the most underrated variable in this category. Two platforms can show different medians for “Senior Product Manager” because they are matching that title to different job descriptions. Most platforms have a job catalog or job leveling framework. Spend time understanding how your roles map to theirs before you trust the numbers.
Ask specifically about sample size transparency. Good platforms will tell you how many data points sit behind a given benchmark. A median based on 12 submissions is not the same as a median based on 400. If a vendor cannot show you sample sizes at the role level, treat the data with caution.
Finally, consider the update frequency relative to your comp review cycle. If you run comp reviews twice a year, quarterly data updates are sufficient. If you are making offer decisions daily in a competitive tech market, you want data that refreshes as payrolls run, which points toward Pave, Carta, Ravio, or Figures over traditional survey-based vendors.
For a broader framework on evaluating HR tech vendors before signing a contract, the HR software buying checklist covers the due diligence questions that apply across categories, including data ownership, implementation timelines, and contract exit terms.
Almost none of the platforms on this list publish per-seat pricing publicly. The category is almost entirely quote-based, with pricing driven by headcount, number of countries, data modules accessed, and seat count for the platform’s comp planning features.
What the market suggests qualitatively: Payscale’s smaller-business products start at entry-level tiers (exact figures are not publicly listed and vary by configuration). Full CompAnalyst deployments for mid-market companies run into thousands per month. Mercer survey access is sold per survey title and can run from a few thousand to over ten thousand dollars depending on which surveys you buy. Radford pricing similarly depends on which survey packages you participate in.
Pave, Carta Total Comp, Figures, and Ravio are all quote-only with no public pricing available. Ravio offers free benchmark access as a way to evaluate data quality before entering a commercial conversation, which is the lowest-friction starting point on this list.
Budget a full quarter for the vendor evaluation process if you are purchasing Mercer or Radford for the first time. These are not tools you buy in a single call. Understanding the hidden costs of HR software, including implementation time, admin overhead, and integration fees, matters here just as much as the license cost.
Compensation benchmarking is the process of comparing your employees’ pay to market data for equivalent roles at comparable companies. The goal is to determine whether your pay bands are competitive enough to attract and retain talent, and whether they are internally equitable across similar roles. Modern tools pull from real employer payroll data or structured surveys and let you filter by industry, geography, company size, and job level to produce relevant comparisons rather than broad national averages.
A salary survey is a specific data product, usually a report or database published annually by a firm like Mercer or Willis Towers Watson. Compensation benchmarking is the process of using that data (or live platform data) to price your roles. Modern benchmarking platforms replace the static survey PDF with a live interface where you filter, match, and price roles in real time. The distinction matters because platforms like Pave and Ravio update continuously rather than once per year, which produces more current numbers for fast-moving markets.
Free sources like the Bureau of Labor Statistics Occupational Employment and Wage Statistics database are reliable for broad national benchmarks but too coarse for pay band design. Glassdoor and LinkedIn salary data are self-reported and carry the accuracy limitations that come with any crowdsourced dataset. Ravio’s free benchmark tier gives access to real employer-submitted data for a limited number of roles, which is more defensible than Glassdoor for comp decisions. For annual merit cycles and formal pay structures, paid platforms with transparent methodology are worth the investment.
Most comp practitioners use two to three sources and triangulate. One broad survey for the full job catalog, one industry-specific source for competitive roles, and sometimes a real-time platform for high-demand positions where annual data lags badly. Using only one source creates blind spots; using five creates paralysis from conflicting numbers. The goal is a primary source you trust plus one validation source for roles where the stakes are highest.
Some do, directly. CompAnalyst by Salary.com and Brightmine both include pay equity analysis modules that flag potential gaps across protected characteristics using your internal data alongside market benchmarks. Pave and Carta focus more on market benchmarking than internal equity analysis. If pay equity compliance is a primary driver, CompAnalyst or a dedicated AI HR compliance and bias audit tool is a more direct fit than a pure benchmarking platform.
Most modern platforms offer HRIS integrations, but depth varies. Pave, Ravio, and Figures are built on HRIS connectivity and require it to contribute data to their networks. Payscale CompAnalyst integrates with Workday and other enterprise HCMs. Mercer and Radford deliver data as exports that you load into your HRIS manually or via a middleware integration. Confirm the specific integration method and data flow before purchasing, particularly if you want compa-ratio visibility inside your HRIS rather than inside the benchmarking tool itself.
A compa-ratio compares an individual employee’s salary to the midpoint of their pay band, expressed as a percentage. A compa-ratio of 100 means the employee is paid exactly at band midpoint. Ratios below 85 typically signal underpayment risk; ratios above 115 may indicate overpayment or promotion lag. Benchmarking tools calculate compa-ratios by matching your employee data to market midpoints from their dataset. Platforms like Pave and CompAnalyst surface compa-ratios across your workforce, letting you prioritize who to adjust in a merit cycle rather than adjusting everyone by a flat percentage.
The most useful frame for this decision is to separate the data problem from the workflow problem. The data problem is whether a platform has enough relevant, current market data to price your specific roles accurately. The workflow problem is whether the platform helps your team actually use that data consistently in offer decisions, comp reviews, and pay equity analyses.
Pave, Radford, and Mercer are primarily data products. They give you excellent market intelligence and assume you have a comp analyst or team capable of turning that intelligence into decisions. Compa solves the workflow problem by sitting on top of existing data sources and making the offer decision workflow faster and more consistent. Payscale and CompAnalyst try to solve both problems in one product, which is why they are the most common entry point for mid-market teams without a dedicated compensation function.
Start with data relevance and sample size for your top twenty most critical roles. If a vendor’s data is thin there, no amount of UX polish closes that gap. Once you have two platforms whose data you trust for your role population, the workflow features and integration depth are what determine the final choice. For most 200 to 800 person US companies, that shortlist is Payscale CompAnalyst versus Pave, with Mercer or Radford as a supplementary survey source for roles where precision matters most. For companies building a global team alongside their US headcount, add Figures or Ravio to that evaluation before signing anything.